Welcome to San Diego Blog | July 18, 2011
Downtown San Diego
Real Estate Market Update
Real Estate Downtown San Diego is seeing a transition from the depressed market of 2007-2010. First of all, we ar seeing the inventory of properties for Sale in Downtown’s 92101 zip code shrink tremendously. As of the time of this article, there are a total of 287 condos for sale on the San Diego Multiple Listing Service which is used by both Realtors and new home sale companies.
Market Absorption Rates for Downtown San Diego Real Estate
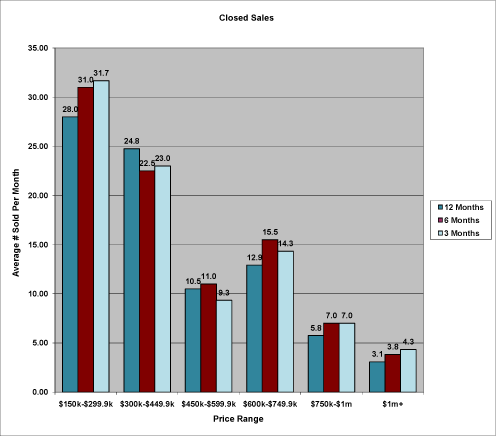
Tis the peak season for Dowtown San Diego Property Sales, but this Quarter’s market absorption rates tell us a story that has been untold since 2001-2006. What’s the news you ask? We’ve actually seen a 28% increase in the number of downtown San Diego condo sales for homes over $1 million. We’ve also seen a 17% increase in the number of San Diego luxury condos sold in the $750,000 to $1 million range.
San Diego Luxury Condos
Does this mean the San Diego luxury condo market is back? Not by any means, but it does show that the pent up supply is starting to get absorbed. If the trend continues, we will see prices start to rise on this San Diego luxury condo market once we get below a 6 months supply of these fine San Diego condos. At the current pace of sales for properties over $1 million, there is a 305 days supply so we’ve still got a ways to go to transition from a buyer’s market to a seller’s market.
| Price Range | ||||
| $150,000-$299,999 | Closed Sales in the past: | 12 month | 6 months | 3 months |
| Number of Homes Sold | 336 | 186 | 95 | |
| Average # Homes Sold per Month | 28.00 | 31.00 | 31.67 | |
| Current Homes Active on Market | 63 | 63 | 63 | |
| Months of Supply | 2.25 | 2.03 | 1.99 | |
| Days of Supply | 68 | 61 | 60 | |
| $300,000-$449,900 | Closed Sales in the past: | 12 month | 6 months | 3 months |
| Number of Homes Sold | 297 | 135 | 69 | |
| Average # Homes Sold per Month | 24.75 | 22.50 | 23.00 | |
| Current Homes Active on Market | 59 | 59 | 59 | |
| Months of Supply | 2.38 | 2.62 | 2.57 | |
| Days of Supply | 72 | 79 | 77 | |
| $450,000-$599,999 | Closed Sales in the past: | 12 month | 6 months | 3 months |
| Number of Homes Sold | 126 | 66 | 28 | |
| Average # Homes Sold per Month | 10.50 | 11.00 | 9.33 | |
| Current Homes Active on Market | 64 | 64 | 64 | |
| Months of Supply | 6.10 | 5.82 | 6.86 | |
| Days of Supply | 183 | 175 | 206 | |
| $600,000-$749,999 | Closed Sales in the past: | 12 month | 6 months | 3 months |
| Number of Homes Sold | 155 | 93 | 43 | |
| Average # Homes Sold per Month | 12.92 | 15.50 | 14.33 | |
| Current Homes Active on Market | 97 | 97 | 97 | |
| Months of Supply | 7.51 | 6.26 | 6.77 | |
| Days of Supply | 225 | 188 | 203 | |
| $750,000-$1m | Closed Sales in the past: | 12 month | 6 months | 3 months |
| Number of Homes Sold | 69 | 42 | 21 | |
| Average # Homes Sold per Month | 5.75 | 7.00 | 7.00 | |
| Current Homes Active on Market | 25 | 25 | 25 | |
| Months of Supply | 4.35 | 3.57 | 3.57 | |
| Days of Supply | 130 | 107 | 107 | |
| > $1m | Closed Sales in the past: | 12 month | 6 months | 3 months |
| Number of Homes Sold | 37 | 23 | 13 | |
| Average # Homes Sold per Month | 3.08 | 3.83 | 4.33 | |
| Current Homes Active on Market | 44 | 44 | 44 | |
| Months of Supply | 14.27 | 11.48 | 10.15 | |
| Days of Supply | 428 | 344 | 305 | |
| * All data is deemed to be reliable, but is not guaranteed. Data pulled directly from Sandicor MLS | ||||
On a different note, for condos Downtown San Diego priced $450,000 and below, we have just over a 2 months inventory so it is definitely a seller’s market. One thing to note is that this is not the seller’s market we experienced in the early 2000’s as today’s seller has to compete with the short sale seller who has nothing at steak to lose… not to mention banks that sell properties for up to 20% under fair market value…we don’t see it all the time, but believe me, we see it and our buyer clients are taking advantage of it!
If you are considering buying or selling a home in downtown San Diego, give us a call: 619-309-8011
